

It may be true that money cannot buy happiness, but knowing your finances are secure can bring piece of mind. To the left, you will find download links to the sheets described below. I will cover 3 basic topics that everyone should be able to work through on their own. Budgeting, loan finance and long term financial planning.
You cannot plan beyond your pay check unless you have a handle on your cash flow. You must understand how much money is flowing into your accounts as well as all your expenditures. I have built a budget sheet that I first used in college many years ago. Over the years it has grown in complexity, but it is still simple enough for anyone to use easily. It works using functions within the cells, and no VBA scripts are utilized; so anyone can follow the operations and understand the sheet.
The sheets is set up to allow an individual or a couple assess their income and expenses. This allows someone to plan a cash flow; you can determine if you are spending more or less than you are taking in. Once you understand your planned clash flow, the sheet allows you to track your spending and verify that your assumptions are accurate. Image 1 shows the tabs that are built into the sheet. The first tab is the budgeting sheet, where the user creates the spending plan. The other tabs are monthly calendars that I use as an accounting tool similar to balancing my check book.
 Image 1: Budget Tabs
The Budget tab contains the planning tools for determining your personal cash flow. The tab is broken into three vertical sections: Income, Deductions, and Expenses. As you approach this tab, it is good to remember that the cells which are light yellow are intended to be user inputs. In the income section, you can input a name in the cell labeled "User 1". The name will show up on all the future lines that reference that users inputs.
For most people, the easiest part to work out is the Income as most know their hourly wage and average hours or their annual salary. If you know your annual salary, input the gross value in the boxed Cell in the image below. If you know your hourly wage, multiply your wage by your average hours worked. If your hours fluctuate wildly, you will have to determine a number that would represent an average income, or perhaps a slightly below average. For someone who works 40 hours per week with a wage of $20/hour, the calculation would be: 20 x 40 x 52 = $41,600.
 Image 2: Budget Income Inputs
Once the gross income is input, you can use your pay stub to help to fill out the rest of the inputs. Set the pay type based on bi-weekly or bi-monthly; if you are paid on a monthly basis, then you will have to do a work around of dividing your values by 2. Before you calculate your tax deduction rate, I recommend filling in the next three cells. 401k% should be the percent you have contributed to an employer sponsored retirement account, such as a 401k or 403b account. PreTax Deductions should be a total of any deductions beyond 401k that are removed from taxable income. These could include healthcare expenses or FSA. Most payroll companies denote these with some marker or label. I exclude parking and transit plans as a separate item because those can be counted as income. Any PreTax Deductions that are completely recoverable should be put in the second category as income. I do not treat FSA as this category, but do treat transit and parking because of their high redemption rates. Now using the Income, which incorporates the deductions, calculate the Tax/Deduciton Rate using the following formula:
Rate = ( Income - ( Federal Income Tax + Social Security Tax + Medicare Tax + State Income Tax ) ) / Income
With these values filled-in, the Income calculations should be summarized in the "Net Paycheck." If not, perhaps the answer is in a hidden group. Look to the left in the sheet, and you will find a group that exposes what I call the additional deductions group.
This groups allows you to include additional items deducted from your paycheck. Paycheck Deductions, Savings Direct Deposits, and IRA Contributions can be included in this section.
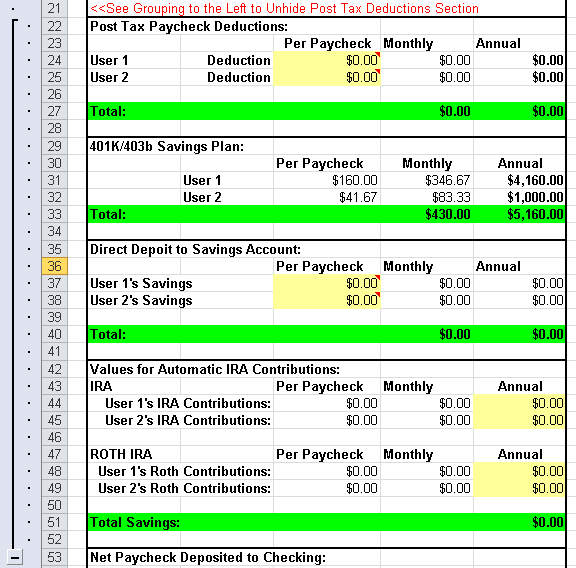 Image 3: Budget Deduction Inputs
With these values filled-in, the Income calculations should be summarized in the "Net Paycheck." If not, check your math and the sheet; it is not not perfect and mistakes can be made. If all the numbers make sense, it is time to address the expenses.
This sheet breaks expenses down into 32 types of expense and those into three categories: Weekly, Monthly, and Annual. The sheet is set to work on these 32 categories. You can replace categories, but I recommend not adding categories unless you understand all the workings of the sheet.
This sheet breaks expenses down into 32 types of expense and those into three categories: Weekly, Monthly, and Annual. The sheet is set to work on these 32 categories. Each category name is fairly obvious as to what is intended; but you can rename categories in the budget sheet. I do not recommend adding categories unless you understand all the workings of the sheet.
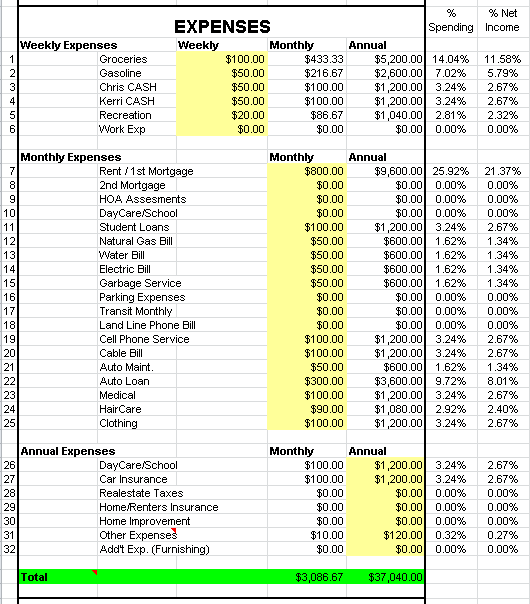 Image 4: Budget Expense Inputs
Each category is totalled up for an annual expense. Also, in the right two columns, the category is shown as a percentage of spending, or expenses, and as a percentage of income. Once the expenses are totalled up, it can be useful to play with values to determine miscellaneous items, such as: How much could I spend on a mortgage? How much could I spend on a Car Payment? These are important items that can be addressed quickly with this budget sheet.
The month tabs are setup to track spending on all 32 categories through three accounts that have been labelled: checking, savings and credit. Image 5 shows two single days from the month sheets. To fill in the table, the user must put the category number in column "B" and the account number in column "A", a description and the amount of the transaction. The account codes determine which account the transaction will affect, i.e. a 1 will affect checking, a 2 wilI affect savings, and a 3 will affect credit. The charge codes affect how the transactions will be tracked in the summary column. If you do not use the summary, you do not need to fill in the charge code, but I recommend using to assist in budget planning. Charge codes 33 and 34 perform special operations, transactions between accounts. These are used to represent transfers between accounts. They will deduct from the first account balance and add to the second balance. Image 6 shows a day completely filled in, which will detailed in the next paragraph.

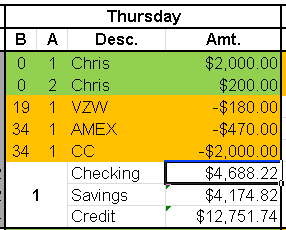 Image 5: Blank Single Day
Image 6: Filled-in Single Day
Image 6 has five transactions shown, which will be explained in detail. Transactions 1 and 2, labelled as Chris represent pay deposits, which are assigned to charge code 0. The difference is one goes into checking because of the account code of 1, and the other into savings per the account code of 2. Transaction 3 represents a payment to Verizon, which is paid out of checking. Transactions 4 and 5 represent payments to credit card companies. Both use charge code 34, so they reduce the checking balance and reduce the debt balance.
Below is the month of January shown blank.
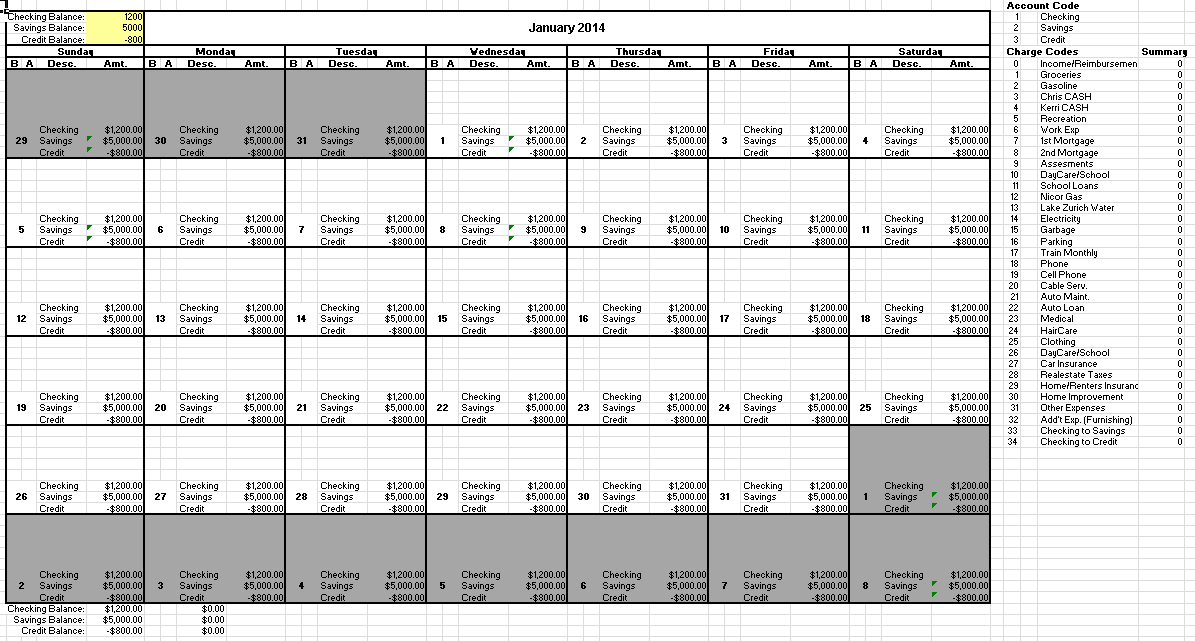 Image 7: Budget Bookkeeping
Note the summary of the account codes and charge codes to teh right of the month. These serve as reminders and the charge codes summarize how much was spent on each code. This is an important tool for checking the accuracy of your budgetary assumptions. As each of month is filled in, the summary values shown in each month are also shown in the Budget Tab, seen below:
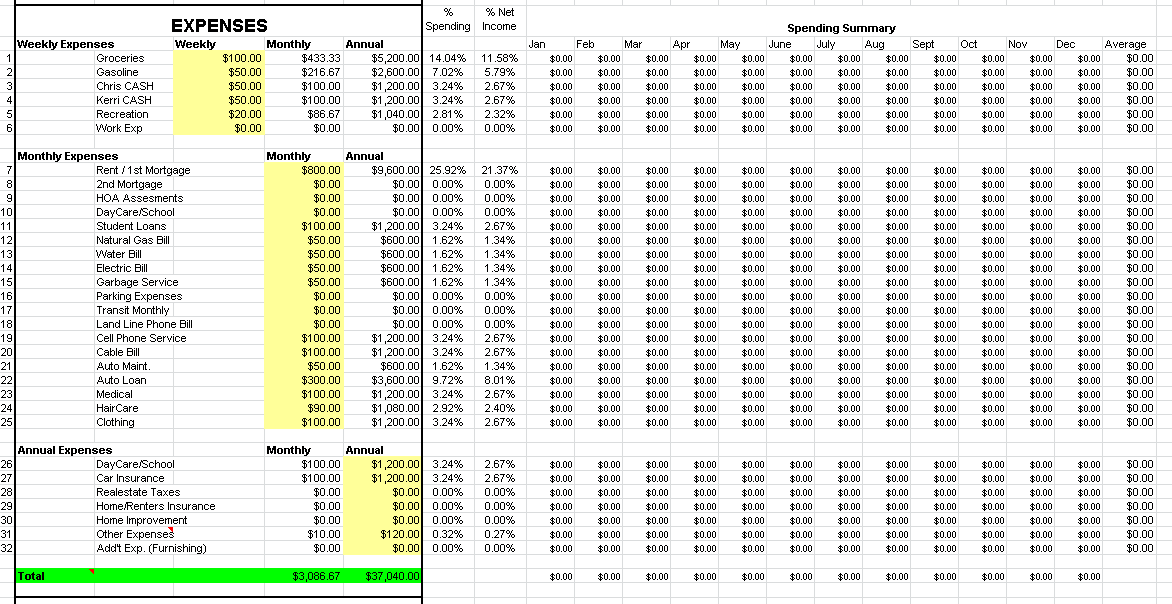 Image 8: Budget Summary Review
These values will allow you to check your budgetary assumptions at the end of the year and set better values for the next year.
I hope this provides some guidance in regards to how my budget sheet should be used, and you will a be able to utilize it to better know your finances. Happy budgeting!
Historically, it is a rare occurrence when someone can afford to buy their first house. So most people have to take out a loan to purchase their house. As time has passed, loans for home improvement and cars have also become common. I built this sheet for when I purchased my first home. I used it in conjunction with my budget sheet to determine how much I could afford given my income at the time. Assuming you have determined your budget, then you could do the same with this sheet.
This sheet is setup to allow quick calculations of monthly payments if you know the required inputs. Image 1 shows the general layout of the sheet. The user input cells are highlighted in light yellow, and the green cells indicate important results. On the left side of the sheet is the automatic payment calculator, which uses basic interest rate formulas to from one of my old college textbooks(1) to determine monthly payments. The right side is a payment record, which allows us to see how the balance would be affected by early payments or periodic additional payments. The following sections will get into the workings of the sheet.
 Image 1: Loan Sheet
This section will focus on the Automatic Payment Calculator. The inputs are the Cost of the item for the loan, reduced by the down payment, labeled in the inputs as Down. For a house, the down payment would typically be 20% of the cost. Deducting the cost from the about The calculation, you would get the loan amount, often referred to as the balance or principle. The next input is the Period, sometimes referred to as the term of the loan, which is assumed to be months. For a typical thirty year home loan, the term will be 360 months. The last input is the interest rate. The last inputs are monthly costs usually associated with owning a house. Taxes(escrow), Assessments, and PMI are the three most common monthly expenses. Note for the example shown, the mortgage payment is only two-thirds of the monthly payment once taxes are PMI are incorporated.
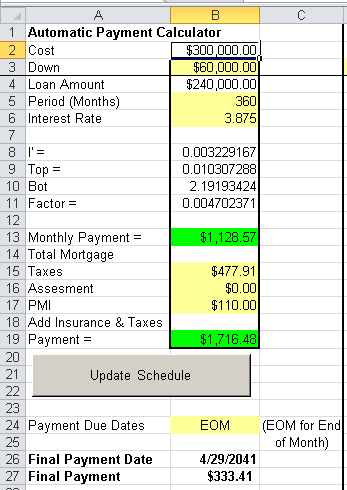 Image 2: Loan Inputs
With the inputs defined, the sheet calculates a Monthly Payment based on the loan principle, term and interest rate. The formula used in this calculation can be seen below in equation E-1.

Due to the complexity of the equation, I broke it into four parts in the spreadsheet. It made the process easier to debug and allowed me to quickly adjust based on compounding frequency. In my experience, the process in this functions to within $5.00 of the calculation performed by every bank with which I have had a mortgage.


The Update Schedule button and input below it are tied to the payment schedule operations. They will be explained in the next section in detail.
If you would like to track your loan balance or determine how much an extra payment will shorten your loan by, this tool is for you. The schedule is automatically populated per the users inputs and can be adjusted as desired see the effects.
The inputs are rather simple. You need to set your payment date below the Update Schedule button and set the start date at the top left of the Payment Record section. Once those are set, hit the Update Schedule button, and watch the schedule get populated and the final payment information will be displayed at the bottom of the Automatic Payment Calculator section.
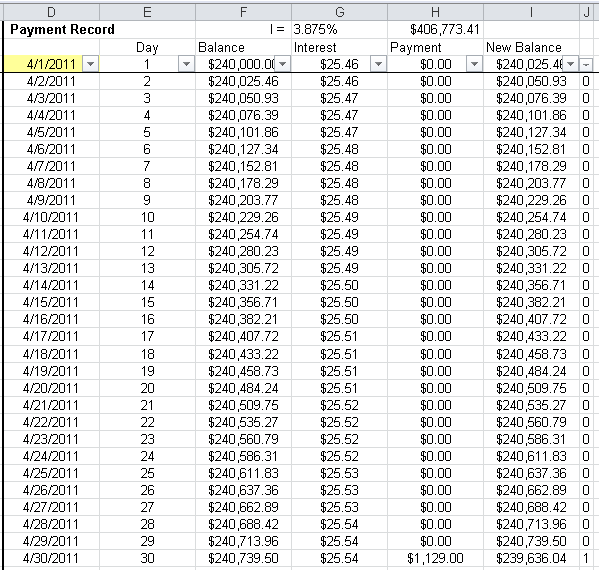 Image 3: Loan Sumary
Each line of the loan summary is a repeating calculation. Column D tallies up the date as column E counts each day in the term of the loan. Column F tracks the starting balance, as columns G and H account for the daily interest and any payments respectively. Columns F, G are summed and H subtracted to get the end of day balance shown in column I. The last column, J, is a marker to indicate where the payments should automatically show up. If you would like an extra payment to show up, add a 1 on the date you want the payment and it should automatically appear. You can also add a payment by manually typing a number into the column H. If you would like to remove a paument, change the column J value to zero and copy a cell down in column H to reset the calculation. Be aware that if you hit the Update Schedule button, you will reset any modifications that you have made. If you are using it to track an actual loan, you may want to delete the button to remove the possibility of resetting the table. Once last note is that the sum of all the payments in the schedule is shown in the first row of column H. This will let you know how much you will be spending to borrow the money.
That is the summary of the loan sheet. I hope you can use to to better plan your finances, or understand the power of compounding interest. Happy Planing!
References: (1) - Newman, Donald G. and Jerome P. Lavelle. Engineering Economic Analysis. Engineering Press:Austin, TX. 1998
So, you have your budget and you are working. To what end are you working? Do you plan on working until your carried out in a pine box? Or do you plan to retire? This sheet is crude tool for planning your escape from the working world. Becasue even though it often changes, everyone should know their retirement number, do you?
Many people approach retirement with uncertainty. I do not want to be one of those people, and I assume you do no either. This sheet is setup to allow you to summarize your retirement assets and plan for the future based on your planned contributions. Below you will see the ability to monitor up to four accounts with an ultimate goal of reaching a target amount of money. As with all my sheets, the inputs are highlighted in light-yellow.
The first is to set your start date, all the way on the left top of your sheet. This is important if you would like to put a real time scale on these estimates. The next is to determine how many and what types of accounts you are going to consider. The sheet is configured for four with some flexibility in regards to how they can estimate outcomes.
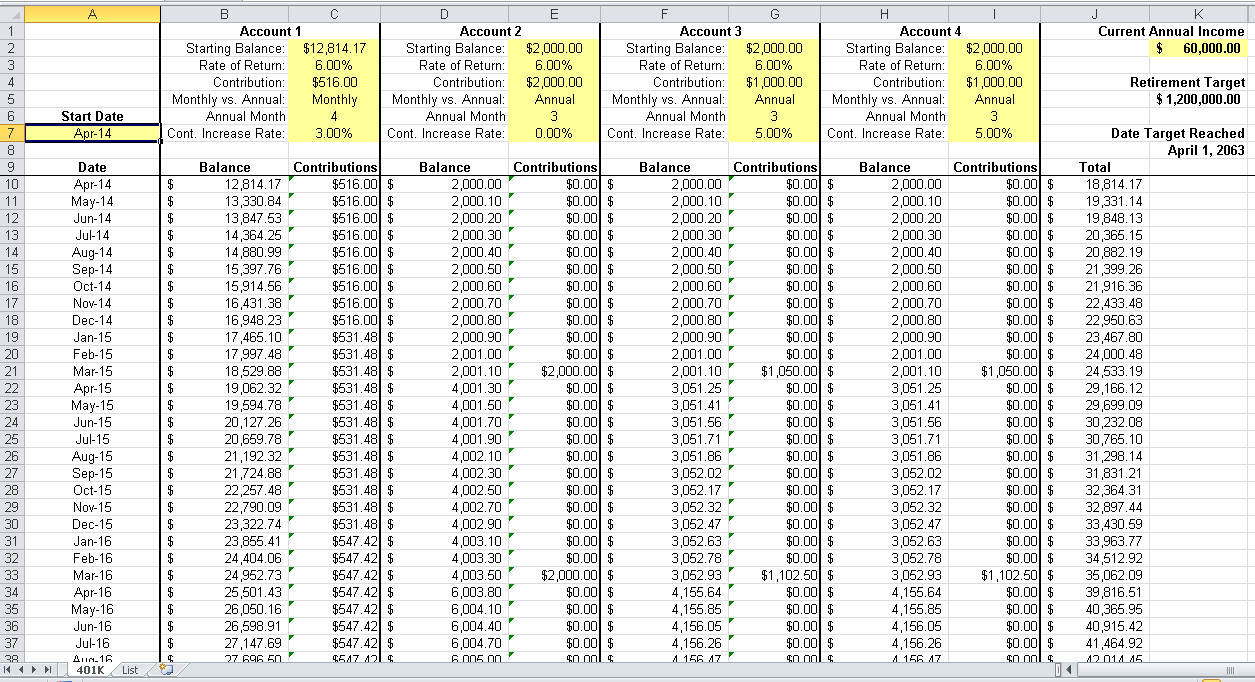 Image 1: Planning Sheet
Below is a blow up of the first two accounts that are included in the downloaded sheet. The inputs are setup to allow for flexibility while still being able to do a reasonable financial structure for a fifty year time span. The inputs are the following: Starting Balance, Rate of Return, Contribution, Monthly vs. Annual, Annual Month, and Contribution Increase Rate. Each input will be explained below.
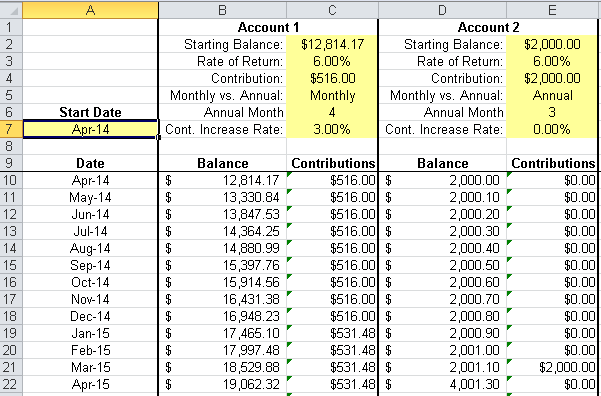 Image 2: Account Inputs
Starting Balance represents the starting balance of an account for this estimate.
Rate of Return is an assumed rate of return for the lifetime of the account. Back when I started contemplating this issue in the late 1990s, this was usually assumed to be about 8%. After my last conversation with a financial advisor, he recommended something in the 4-5% range. Fidelity Investments has posted articles concurring with this. I use 6% on the basis that I have never had a period of five years where I have returned less than 10%, and yes that does include the last two recessions. Rate of Retrun is provided as an input so that the user can do research and set it per their tolerable investor risk tolerance.
Contribution is intended to represent your regular contributions to the account. As an example, if I contribute a constant 10% of every pay check to my 401k, I will contribute about the same amount each month. I can set this monthly value here. As an alternate, I contribute to my IRAs each March after I figure my taxes. I can also set that value and control how often the contribution occurs with the next input.
Monthly vs. Annual and Annual Month allows the user to state how often the contribution occurs. Monthly indicates that the contribution will show up each and every month. Setting it to Annual will make the contribution show up just one month per year. The Annual Month input allows the user to specify which month has the contribution. This provides some flexibility in contributions. If you would like more options, try to create your own. And if that does not work, the user can always input everything manually.
Contribution Increase Rate is the last input, and it allows the user to have the contribution increase each year at the specified rate. For my 401k, I set it at a 3% increase, based on my salary increasing at 3% per year. For an IRA, I did not set the contribution to increase, becasue that is more of an unknown.
The next item is to estimate a target based on income. The sheet uses the general estimate of 20x your desired annual retirement income. This is a fairly common multiplier thrown around by financial planners. The final column shows you the date when you will hit your target if you follow your plan.
 Image 3: Loan Summary
This is a good tool for helping someone estimate how they will make it to retirement. It does not replace meeting with a financial advisor, but it will help provide initial guidance as well as a way to check what the advisor is recommending.